Project type
Master Graduation Project
Role
Researcher +
UI & UX designer
Platform
Desktop Dashboard
Date
October 2019
To end the master track New Media Design at the Tilburg University, I completed a graduation project in collaboration with Philips Research. During this project I combined a literature and scientific research with a iterative designprocess, to result in both a master-worthy thesis and a complete communication strategy for Philips in the shape of a concrete Dashboard design.
Context
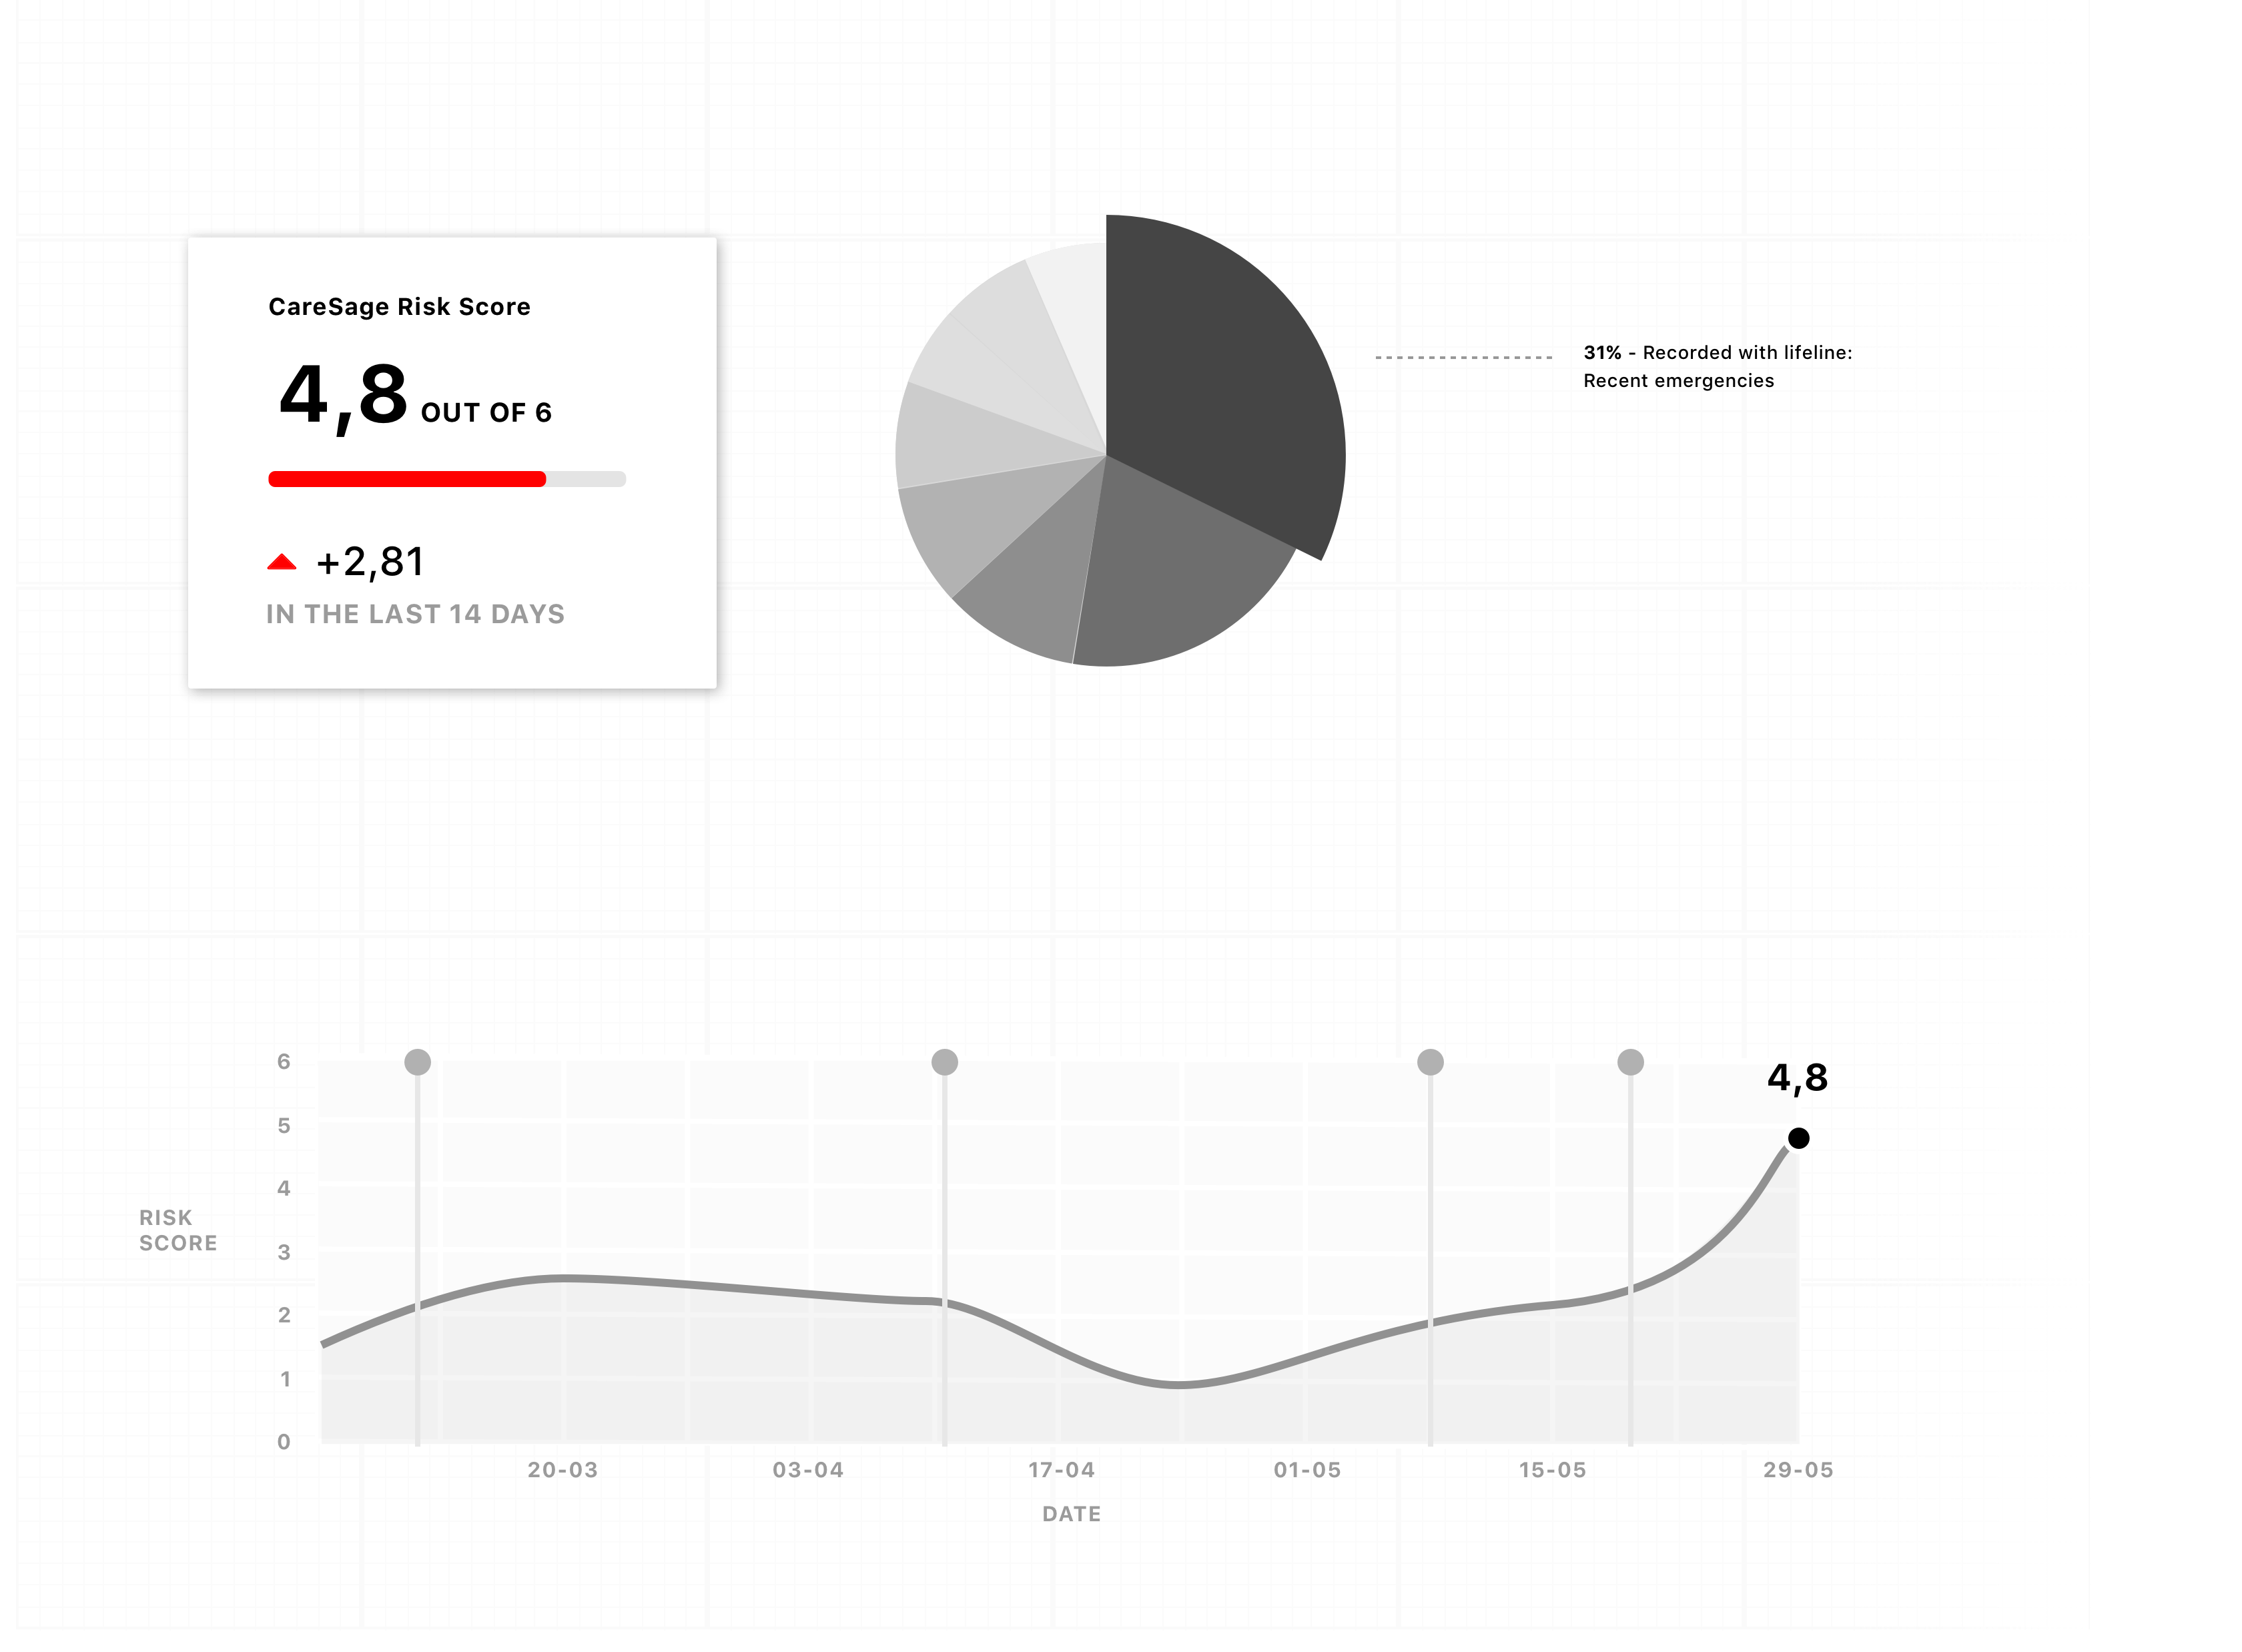
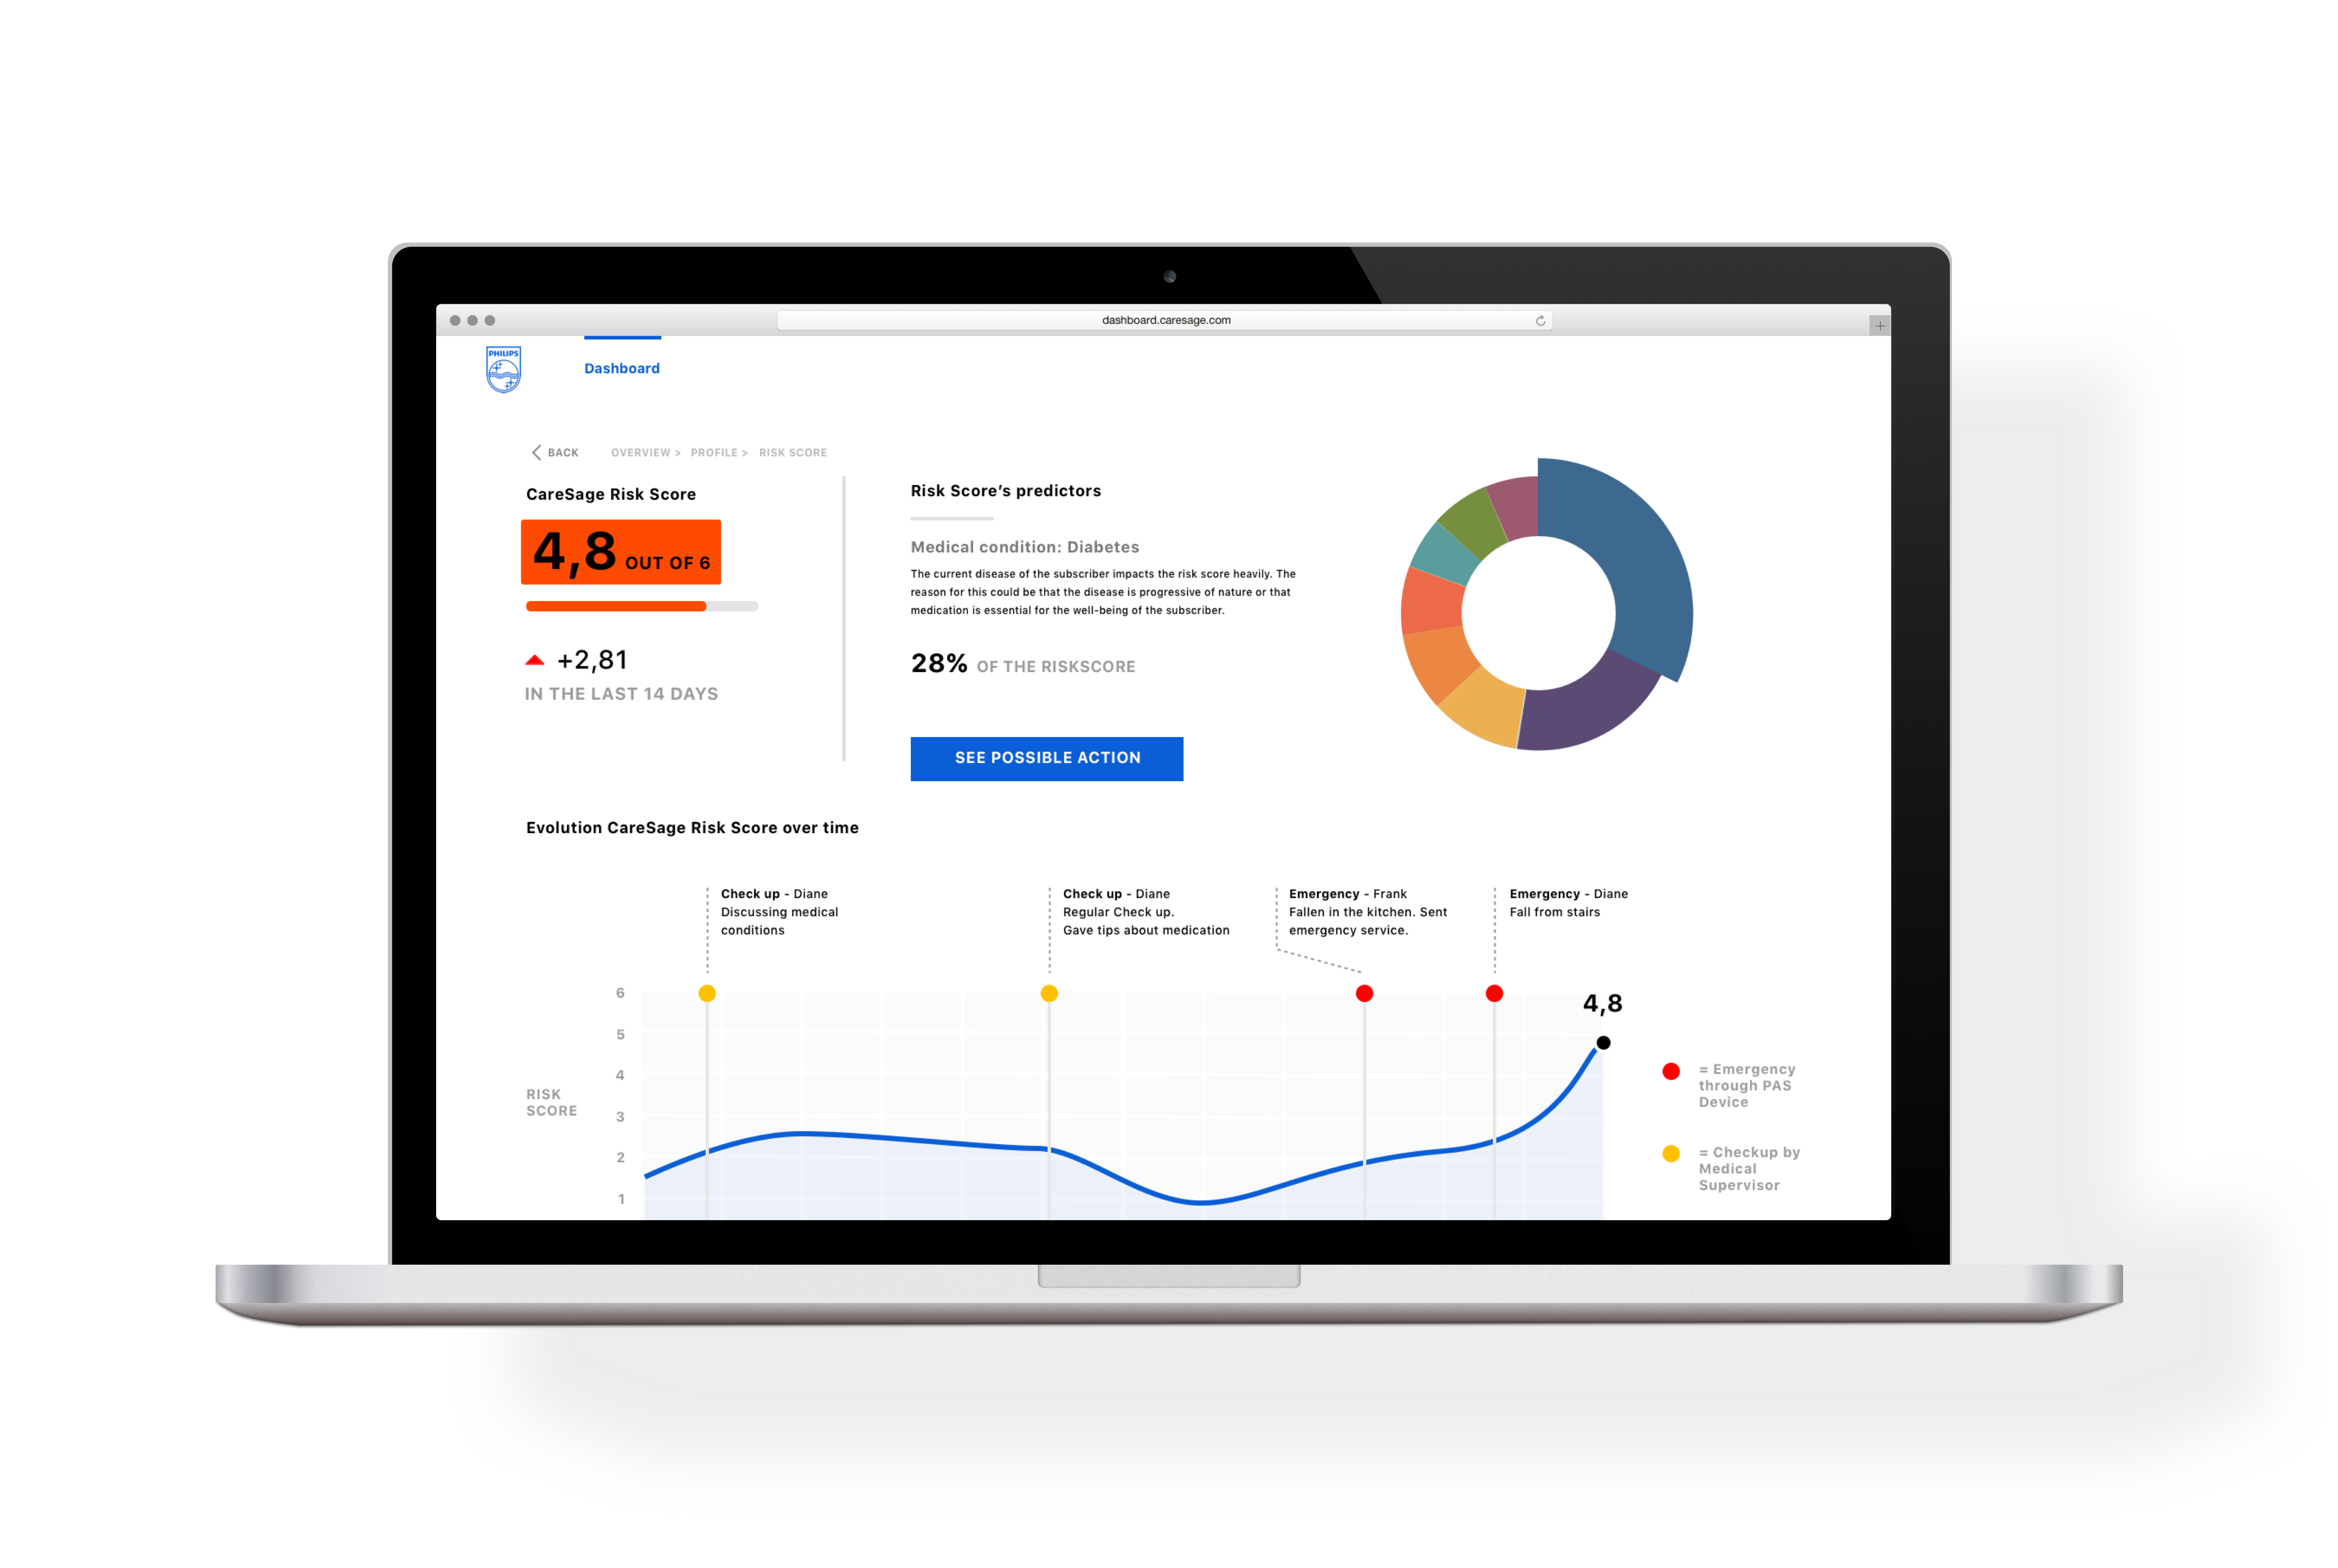
Philips offers a medical alert system to elderly people to ensure adequate medical care in case of an emergency, this service is called Philips Lifeline. In order to compliment the proactive care service that Philips envisions, an algorithm was developed by Philips Research that predicts the risk of a hospitalization of a use of the Lifeline service. This algorithm, called CareSage, is based on the recorded data of the Lifeline service and the results in a risk score. For my graduation project, I focused on communicating user risk data (including the risk score) to medical professionals in order to offer greater insight in to the user’s wellbeing.
Design opportunity
Offer medical more insight in the wellbeing of the users and communicate risk cases, in attempt to prevent emergencies from happening
Research phase
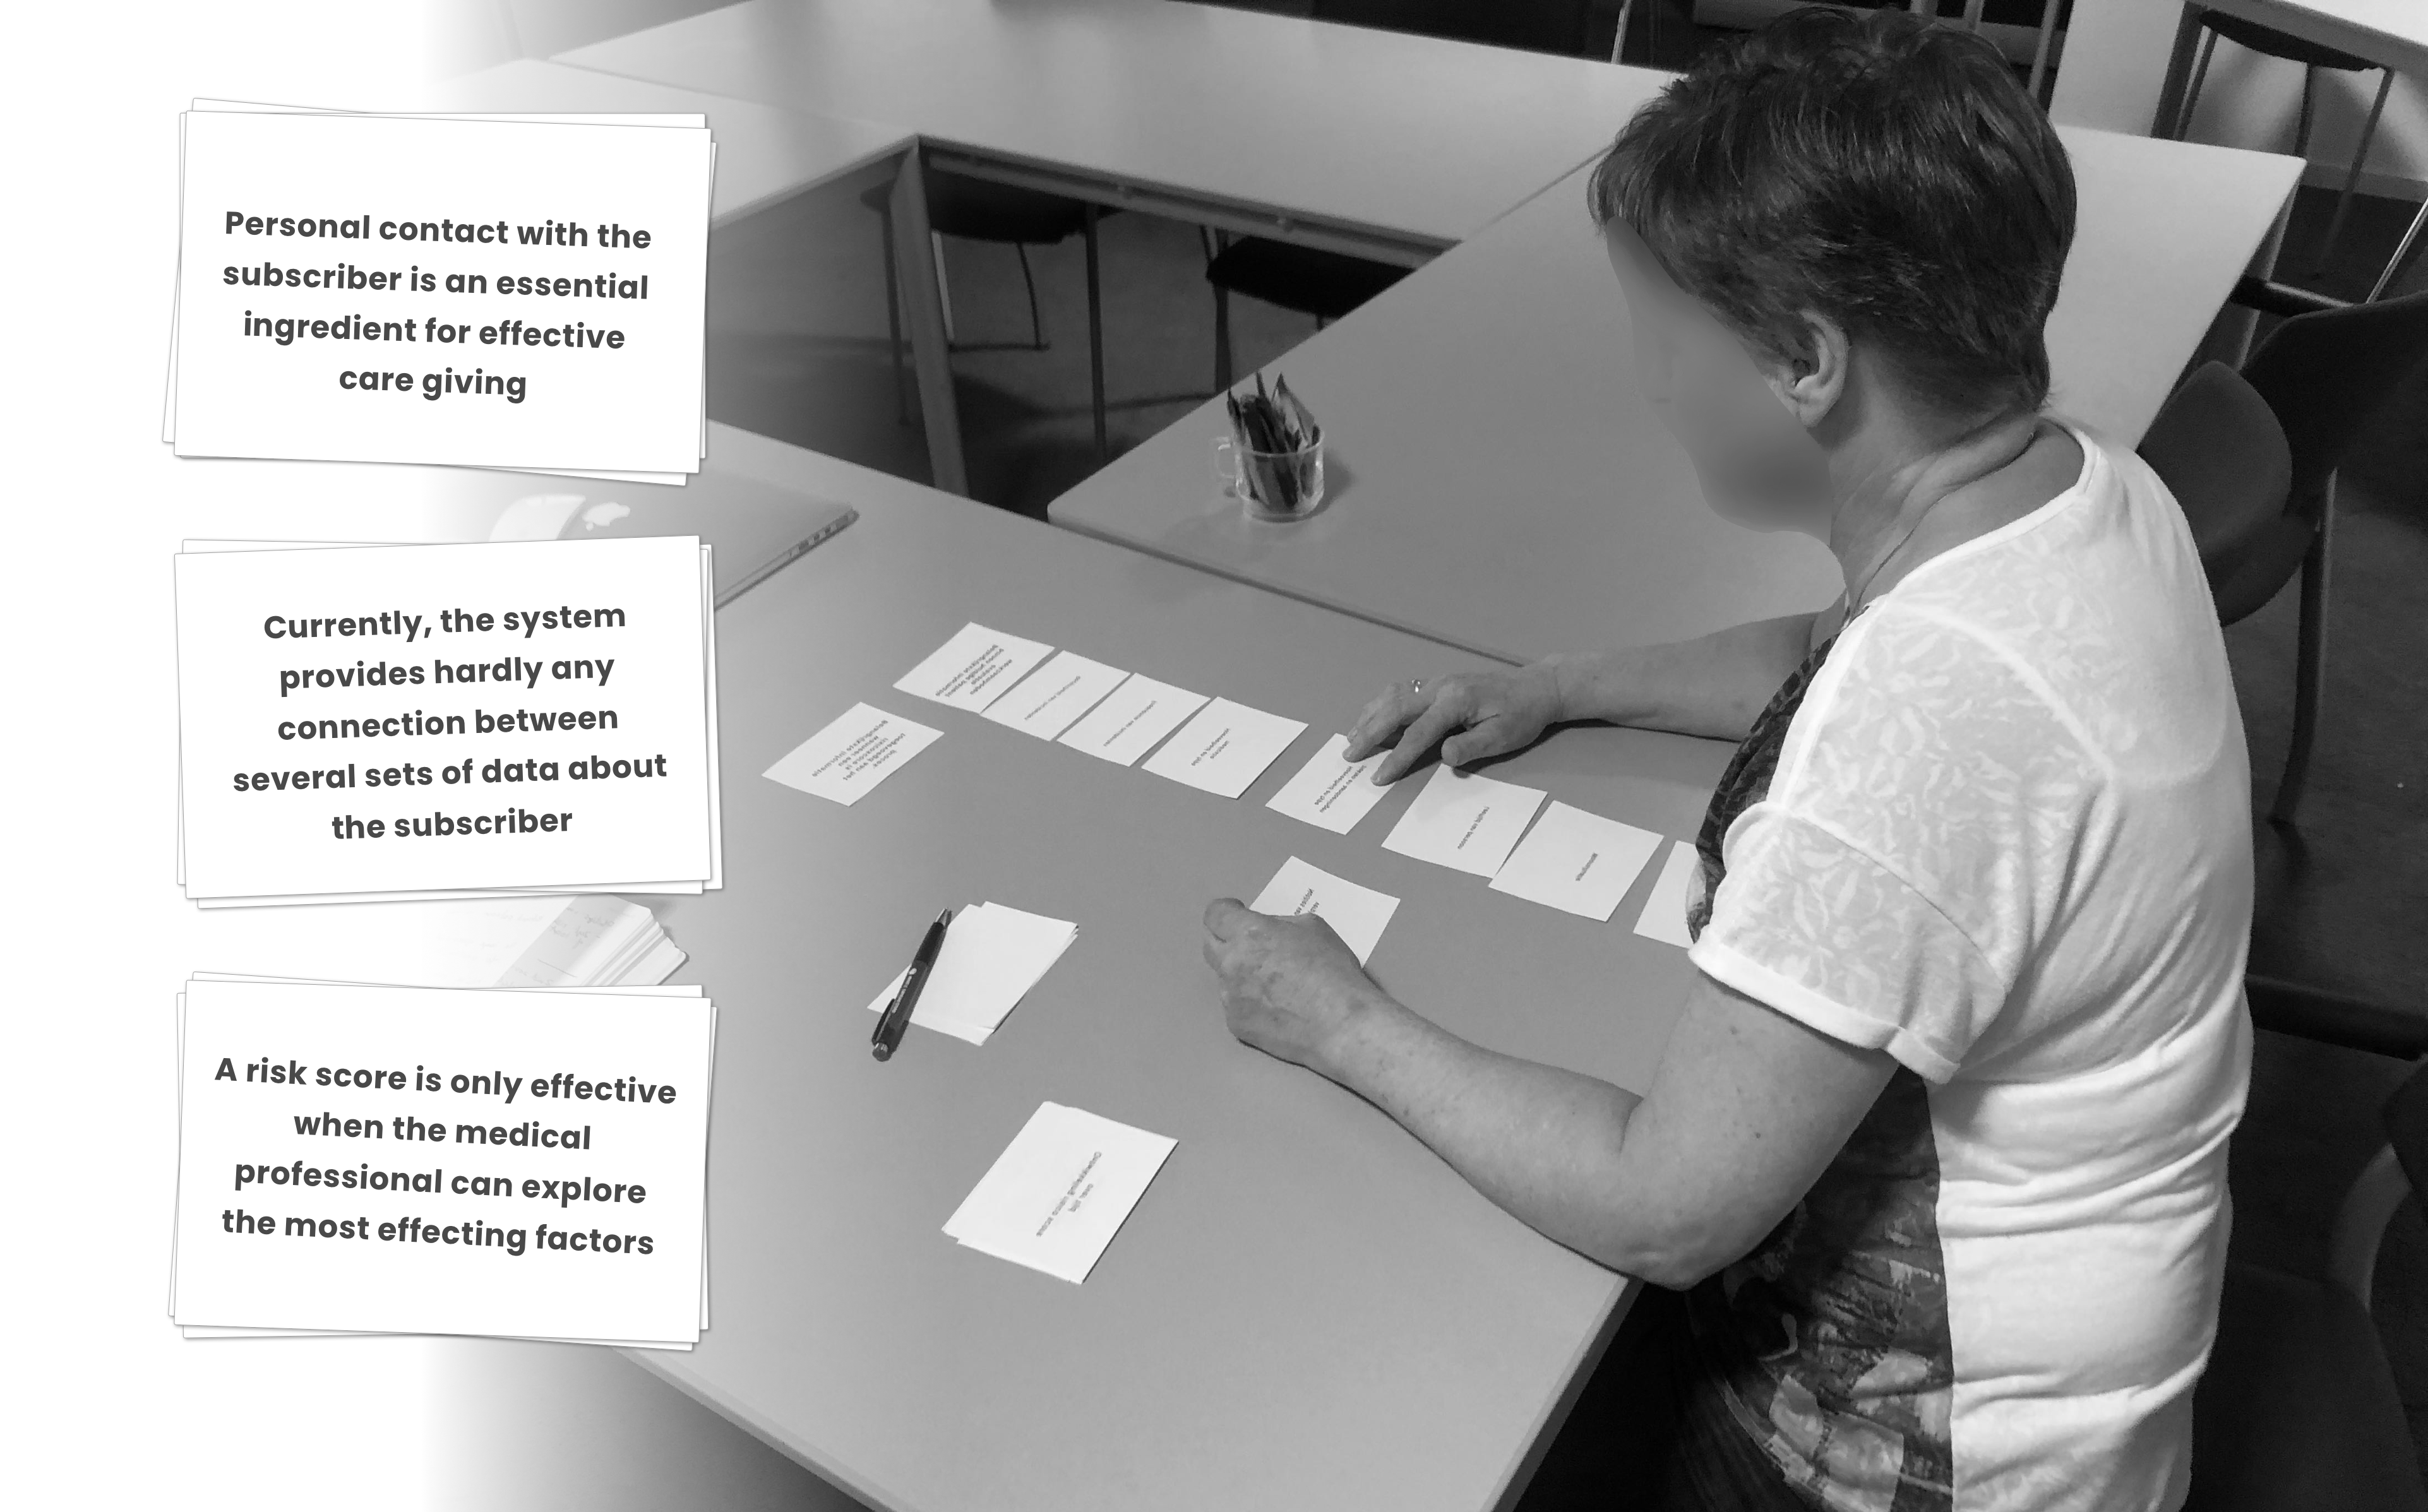
During this thesis project, I intended to both contribute to the knowledge gap of communicating risk analytics to medical professionals, as delivering an concrete product that helps Philips offer pro-active care for their subscribers. In order to gain more insight in the workflow and needs of the medical professionals, I organized workshops with so-called medical supervisors. From this session, consisting of interviews and creative methods such as card sorting, I extracted a few key insights which formed a base for the design phase.
Exploring the data — Diving into data and prototype
Initially, it was essential to get a better grip on what data I was working with. Therefore, I dived into what the risk score encapsulates and how it could be combined with all recorded data concerning the profile and development of the subscribers' health. To rapidly envision how data could help medical professionals in providing adequate care, multiple iterations on data visualisations were designed.
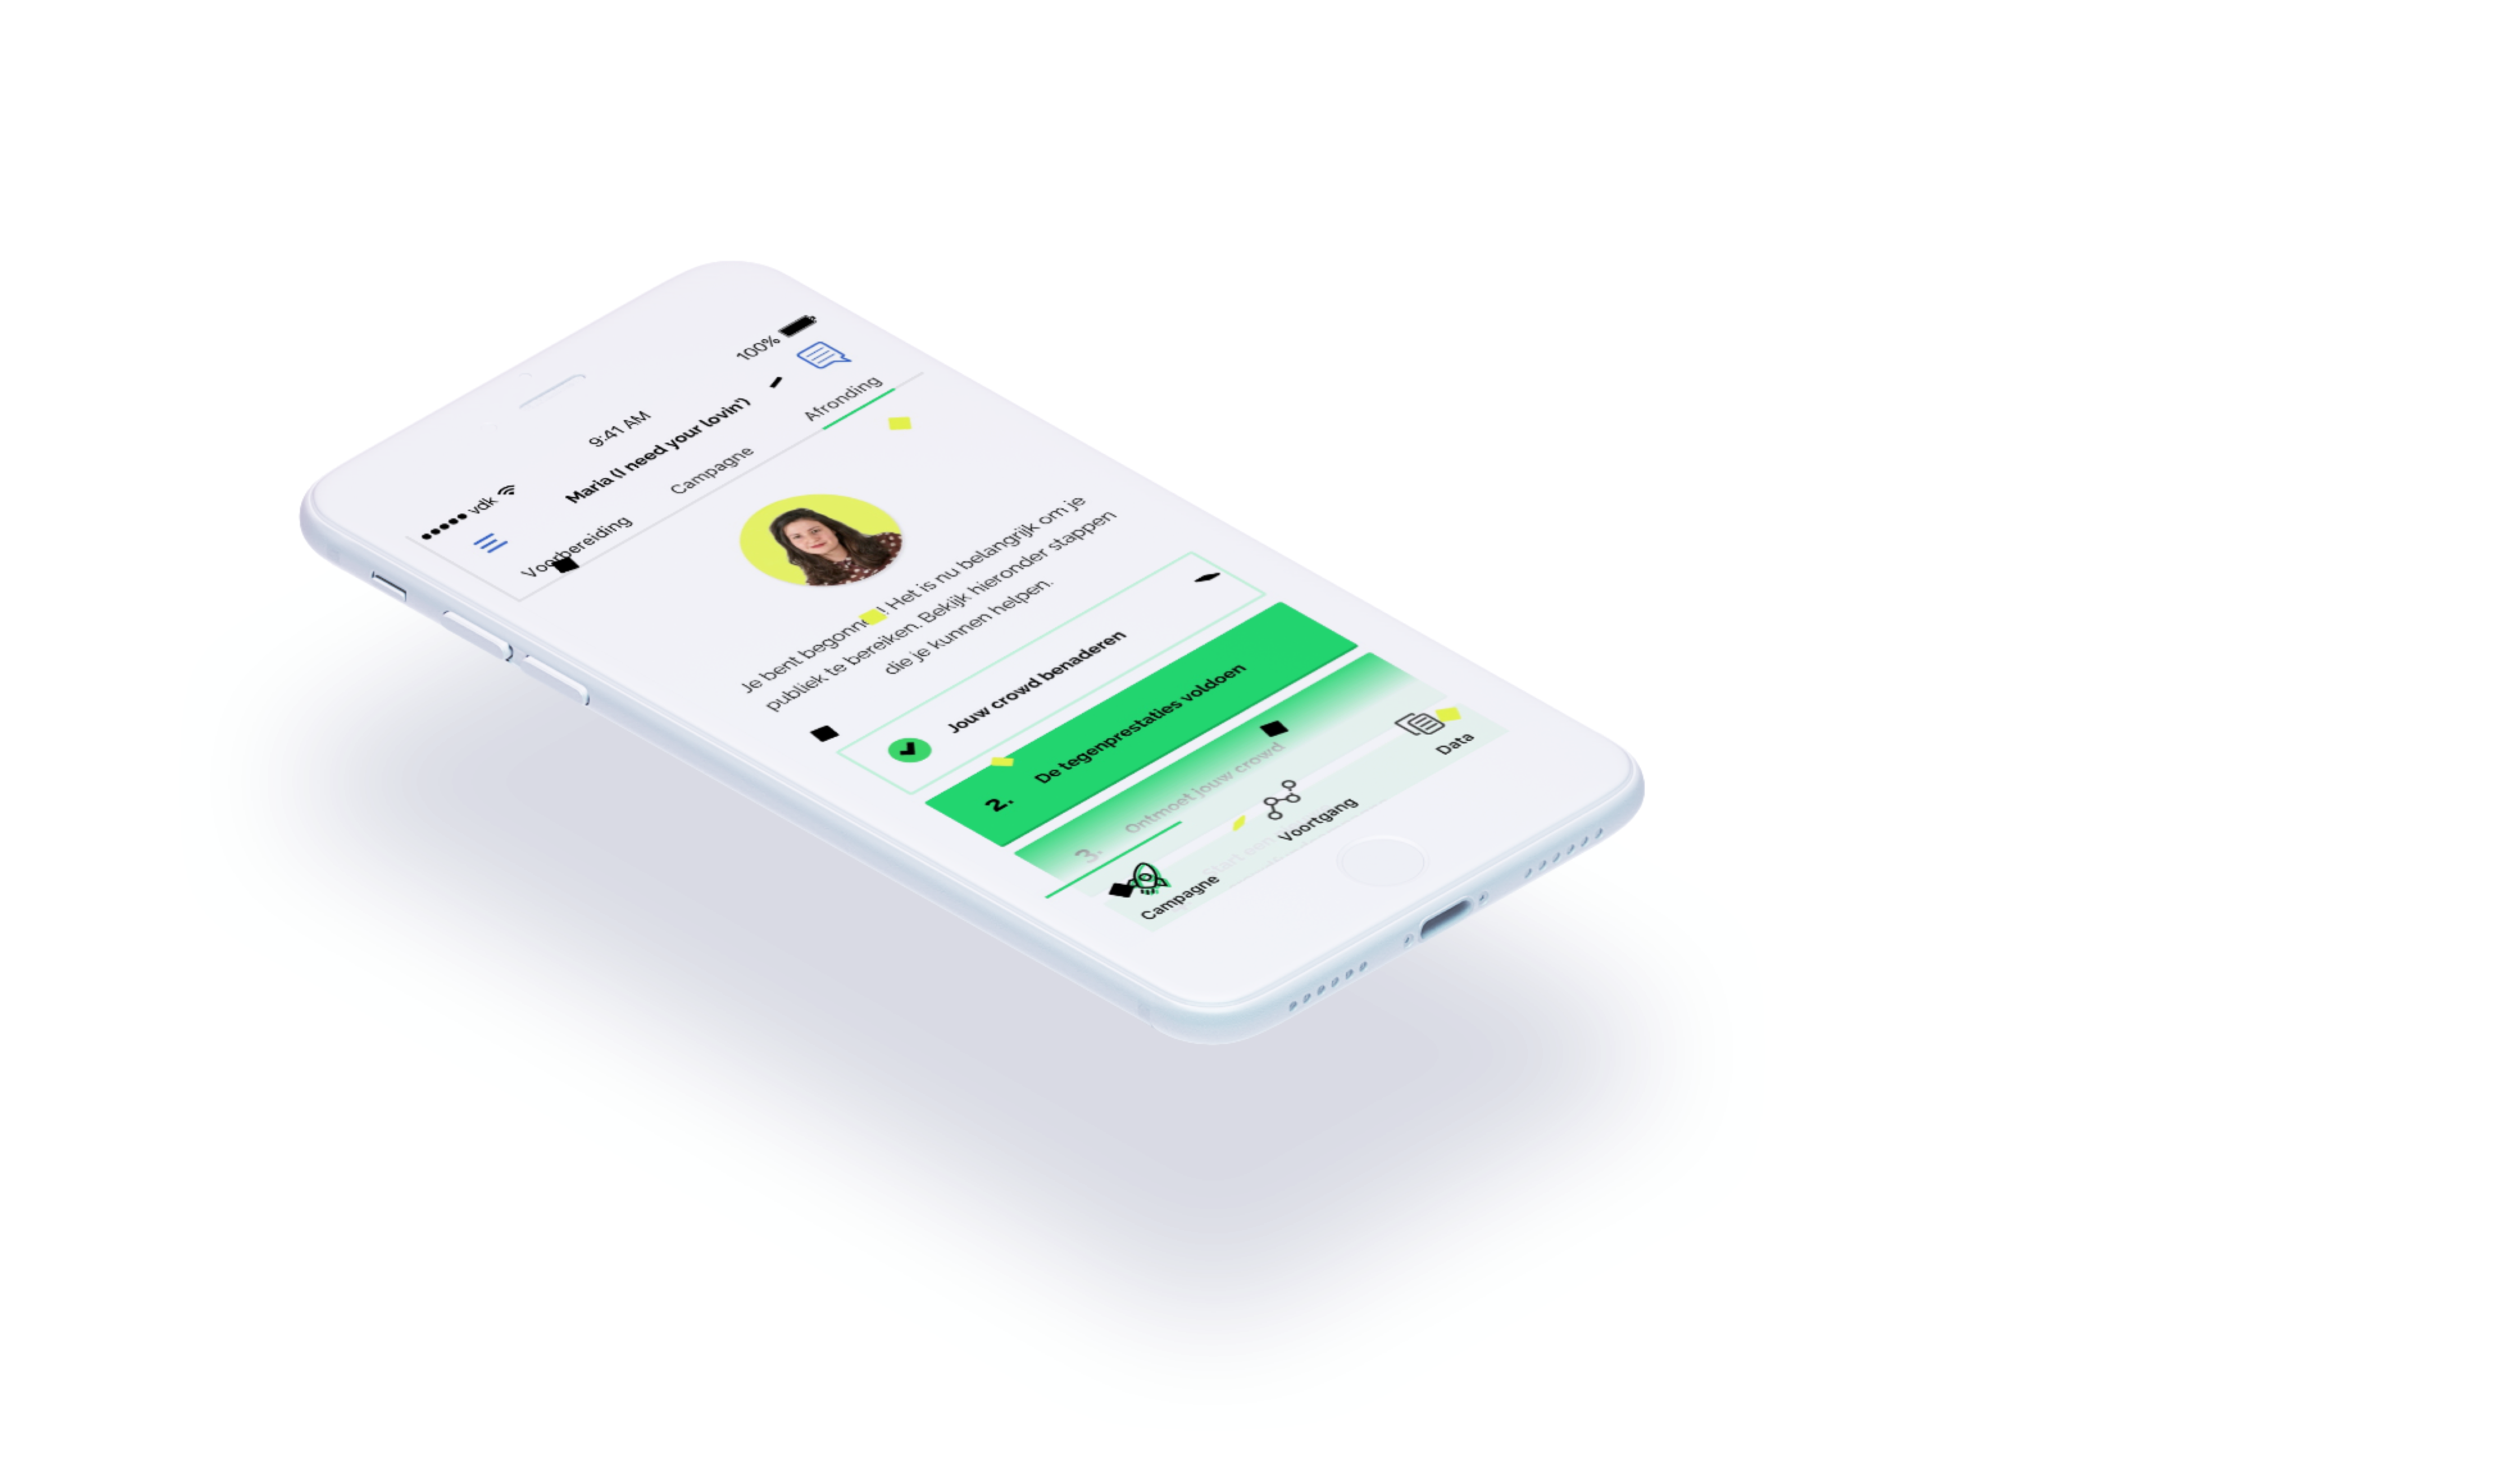
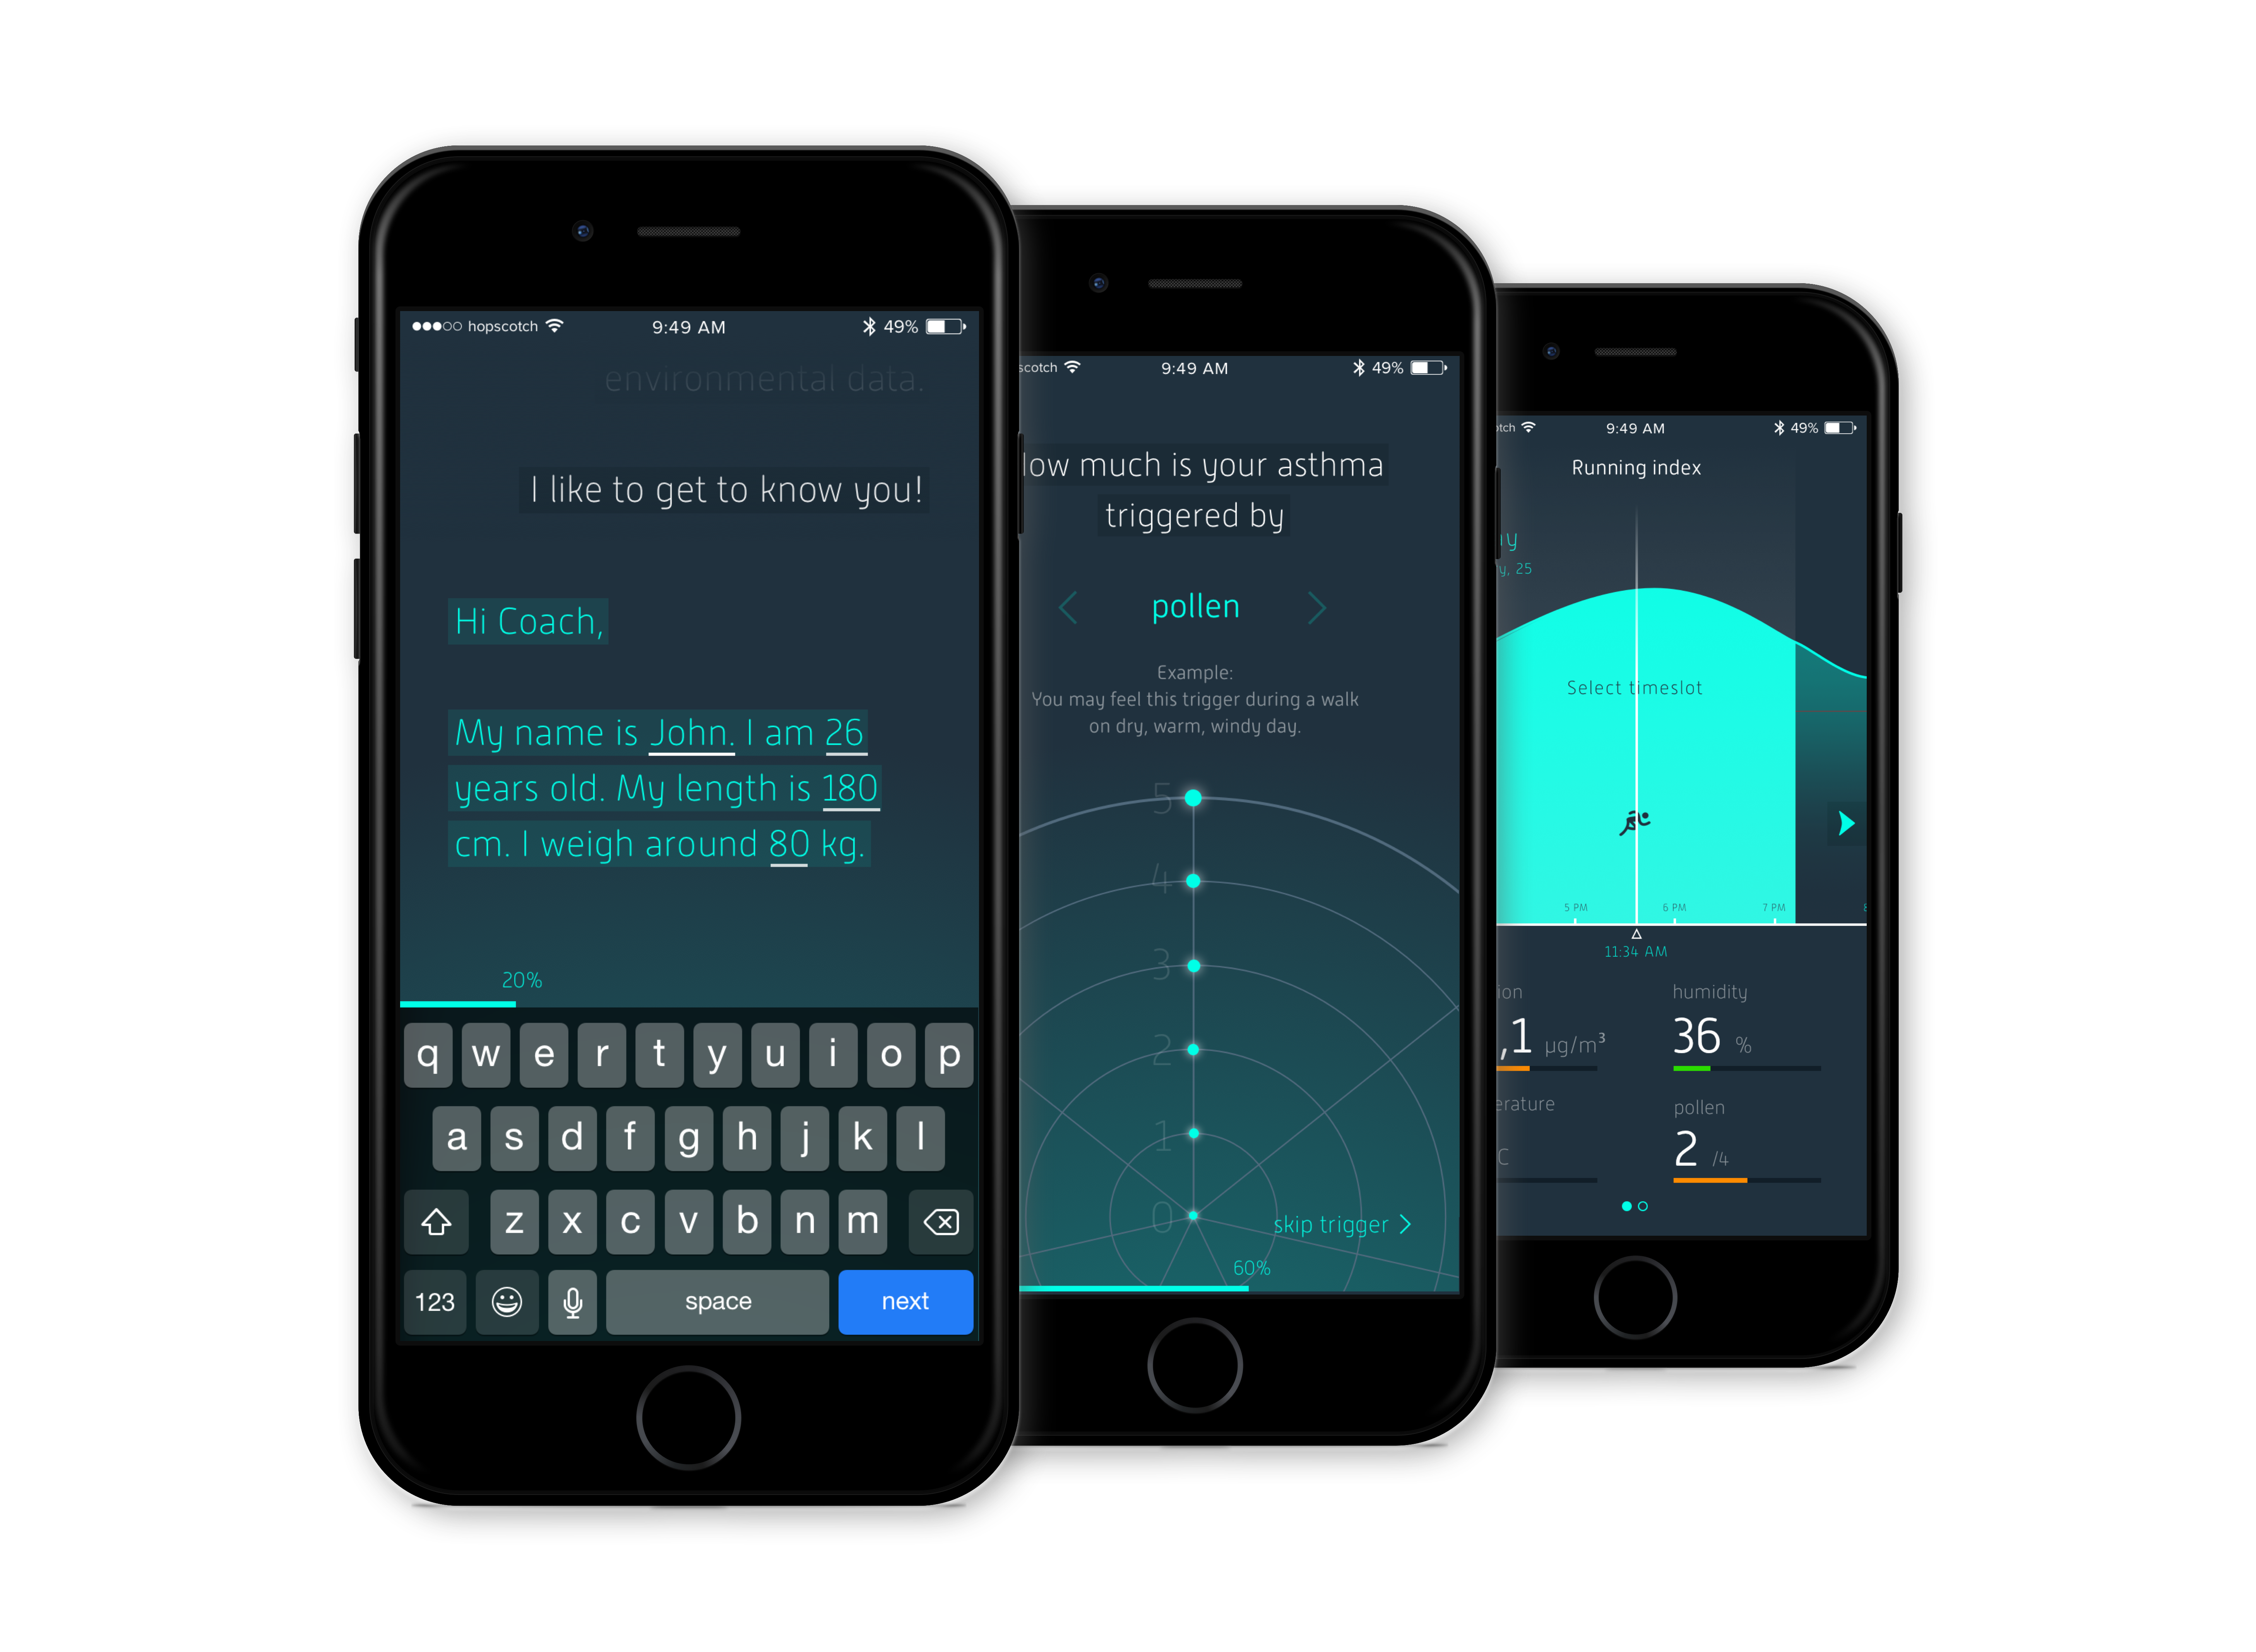
Prototyping
To test what type of risk communication strategy was most effective, prototypes were created that differed in visual language type and level of transparency. In terms of transparency, a balans was sought between giving enough explanation alongside data such as the risk score, and not getting to technical, as the user is not used evaluating complex data.
Results — Guidelines for risk communication towards medical professionals
As a part of my thesis, I used this design process to contribute to a field of knowledge within the academic communication industry. During the design of the prototypes I used heuristics that help users reflect on personal data, mostly recorded with wearables (Cuttone et al., 2014). I used my insights to formulate a set of guidelines specifically for risk communication towards medical professionals. See a fragment of these guidelines besides.
1. Enable the medical professional to explore the underlying data behind the risk analysis, in order to gain a complete assessment of the subscriber's health situation
2. Use interactivity, not only to visualize complex data, but also to create an engaging experience throughout the subscriber-assessment
and so on...
Thanks for reading — See my other projects
See other projects